Daily Leverage Certificates
DLC Hotline: (65) 6226 2828
Market Commentary (Hong Kong)
For the week ending 22 March 2024
Following this week’s central bank action i.e. Fed dovish, BOJ hike, SNB cut, the Dow, Nasdaq and Nikkei 225 went on to print new highs. DXY strengthened and USDJPY is just 50 pips away from its 52-week high.
● Nvidia expands cooperation with Chinese automakers in areas of in-vehicle chips, brand experience.
● Bank of Japan terminated its negative interest policy, to allow rates to rise up to 10 basis points above zero.
● China’s stock regulator charged Evergrande with fraud by inflating revenue by over US$78 billion; multiple executives including founder Hui Ka Yan were charged and handed punishments.
● The US Federal Reserve held policy rates steady and according to multiple reports, Chairman Powell was unexpectedly dovish in the following press conference.
● Eurozone March PMI fell to 45.7, missing consensus of 47.0. It was 46.5 in February.
● SNB cut its policy rate by 25 basis points in a surprise move.
Hang Seng Index closed this week at 16499, down 221 points or 1.32%. This week and last’s candlestick revealed price reacting to the 150-Day SMA overhead (yellow). As we can see from the second circle from the left, the 150-Day SMA has previously acted as resistance before. This week’s bearish candle also closed below the 100-Day SMA (red) which was also a valid resistance (see first circle from left). With this week’s price action, the longer moving average indicators appear to have asserted themselves. Importantly this week’s action closed below all moving averages except the 50-Day (purple). This is a setup associated with further losses although the 50-Day could serve as potential support. In conjunction, take note of the 16000 level. This is a psychological level associated with potential support. Note that last year’s 52-week low lies around here, specifically at 15972.
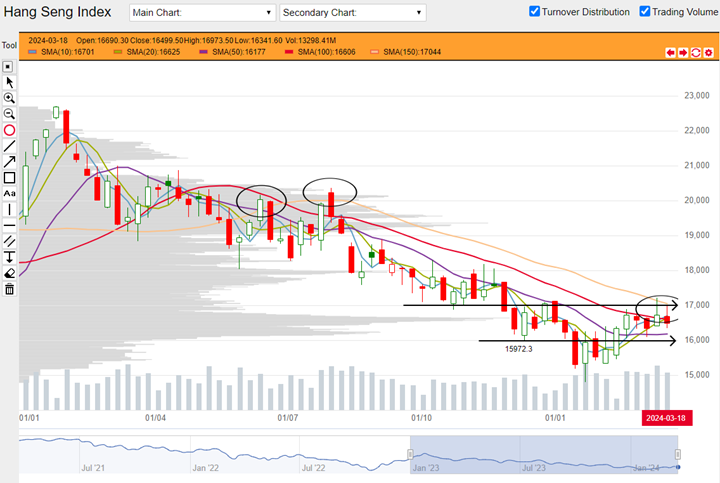
HSI weekly chart from 02 January 2023 to 22 March 2024 (Source: DLC.socgen.com)
Hang Seng Tech closed the week at 3456, down 94 points or 2.65%. Based on price action over this week and last, we can see that HSTech was likely reacting to the 100-Day SMA (red) but also to a previous swing low. This week’s action closed the index below all of its moving average indicators except the 50-Day (purple). This action is associated with continuation of the previous downtrend although the 50-Day SMA could be a potential support. No prominent reversal pattern is visible so far.
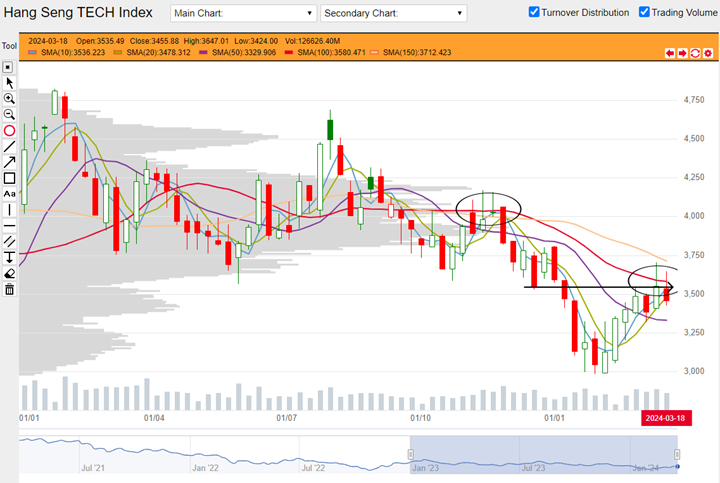
HSTech weekly chart from 02 January 2023 to 22 March 2024 (Source: DLC.socgen.com)
Both Dow and Nasdaq closed above their entire complex of moving average indicators. Such a setup is associated with further gains.
The next FOMC meeting is scheduled on 01 May 2024.
Fed funds futures on rate hike probability by next Fed meeting as at this week’s close:
● 87.7% probability of no change |12.3% probability of 25 basis points cut
Fed funds futures on rate hike probability by next Fed meeting at last week’s close:
● 98.0% probability of no change |2.0% probability of 25 basis points cut
Probabilities on the CME Fedwatch Tool indicate no more rate hikes for this year but also indicate possibility for rates to stay at current level until April next year. Probabilities predict a cumulative 150 basis points cut for the whole of 2024 and up to 225 basis points between now till March 2025.
Both the Shanghai and Shenzhen indices made new year-to-date highs this week but ended in down candles. Shanghai lost 0.22% while Shenzhen lost 0.49%. On the other hand both remain above their 20-Day SMAs. Both 10- and 20-Day SMAs rose and signaled that upward momentum remains intact so far.
Other news:
● AIA and Kuaishou bought back shares.
● AAC Technologies, CNOOC and Petrochina printed new 52-week highs. Sunny Optical and Wuxi Biologics printed new 52-week lows.
● BYD will enter the Greek market with the launch of two models.
● China Daily reported that Apple CEO Cook met with several suppliers in Shanghai including BYD Electronics.
● Meituan posted a profit of 13.86 billion yuan for 2023 versus 6.69 billion yuan loss for the previous year.
● Alibaba sold 30.85 million Bilibili ADRs.
● Alibaba’s unit Taobao China sold 33 million Xpeng ADRs according to a filing with the SEC.
● There is a report that Apple talked to Baidu about installing the latter’s AI in Apple’s China gadgets. Both parties did not comment.
Technical observations
China Mobile 941.hk in a prominent channel.
Note chart features:
1. China Mobile is confined within a very prominent channel with its highest end-of-week close at $68.45 printed in May last year and lowest end-of-week close at $61.65 printed in November. With such a prominent pattern over a significant duration, there are two ideas that jump out: 1. consolidation for higher move and 2. triple top with the third head being formed.
2. Price is trading above all of its moving averages. This is a setup associated with further gains. This also is in line with the potential consolidation for a higher move. There is a smaller rectangle being formed at the moment that could also be a consolidation. Overhead resistance has to be overcome, otherwise this pattern could continue sideways.
3. Should one be looking out for a triple top, then price falling below its averages or out of the smaller rectangle could be a potential signal. The 100- and 150-Day SMAs below (red and yellow) could also be potential support.
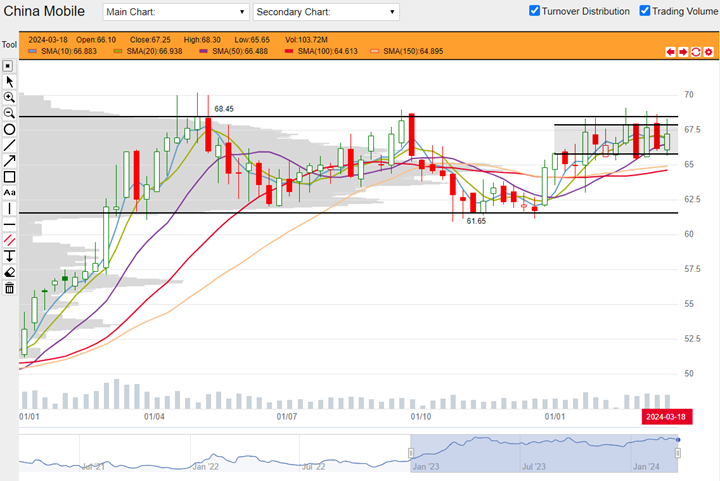
China Mobile 941.hk weekly chart from 03 January 2022 to 15 March 2024. (Source: DLC.socgen.com)
Underlying Index/Stock |
Underlying Chg (%)1 |
Long DLC (Bid Change%2) |
Short DLC (Bid Change%2) |
|---|---|---|---|
| Hang Seng Index (HSI) | -0.90% | ECSW (-4.89%) | CZRW (+6.09%) |
| Hang Seng TECH Index (HSTECH) | -1.29% | UQTW (-9.39%) | CVYW (+14.73%) |
| China Mobile (0941.HK) | +0.43% | DTMW (+3.94%) | DUHW (-2.38%) |
Brought to you by SG DLC Team
This advertisement has not been reviewed by the Monetary Authority of Singapore. This advertisement is distributed by Société Générale, Singapore Branch. This advertisement does not form part of any offer or invitation to buy or sell any daily leverage certificates (the “DLCs”), and nothing herein should be considered as financial advice or recommendation. The price may rise and fall in value rapidly and holders may lose all of their investment. Any past performance is not indicative of future performance. Investments in DLCs carry significant risks, please see dlc.socgen.com for further information and relevant risks. The DLCs are for specified investment products (SIP) qualified investors only.
Full Disclaimer - here